What is Market Cap in Cryptocurrency? A Simple Guide to Crypto Valuation
Imagine you see two different coins for sale. One costs $0.10, and the other costs $1,000. Your instinct might tell you that the $1,000 coin is the 'bigger' or more valuable investment. But in the world of cryptocurrency, which is a digital asset system built on blockchain technology that allows for secure, decentralized transactions, price per token can be incredibly misleading. That expensive coin might only have a few units left, while the cheap one could have billions in circulation.
This is where market capitalization, often shortened to market cap, comes in. It is the single most important metric for understanding the true size and value of a crypto project. Unlike stock prices, which reflect ownership in a company, crypto market cap reflects the total value of all tokens currently available to trade. If you want to make smart investment decisions, you need to stop looking at just the price tag and start looking at the market cap.
The Formula: How Market Cap Is Calculated
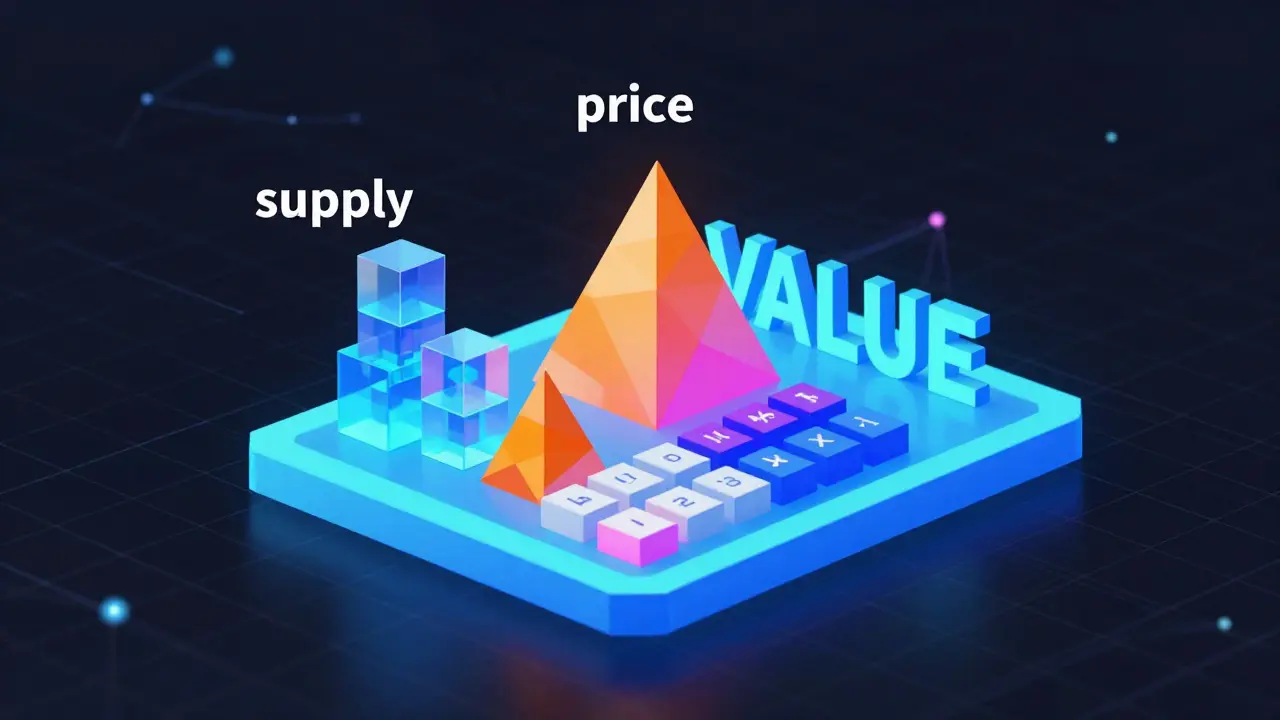
The calculation behind market cap is surprisingly simple. You don't need a degree in finance to figure it out. The formula is:
Market Cap = Circulating Supply × Current Price Per Token
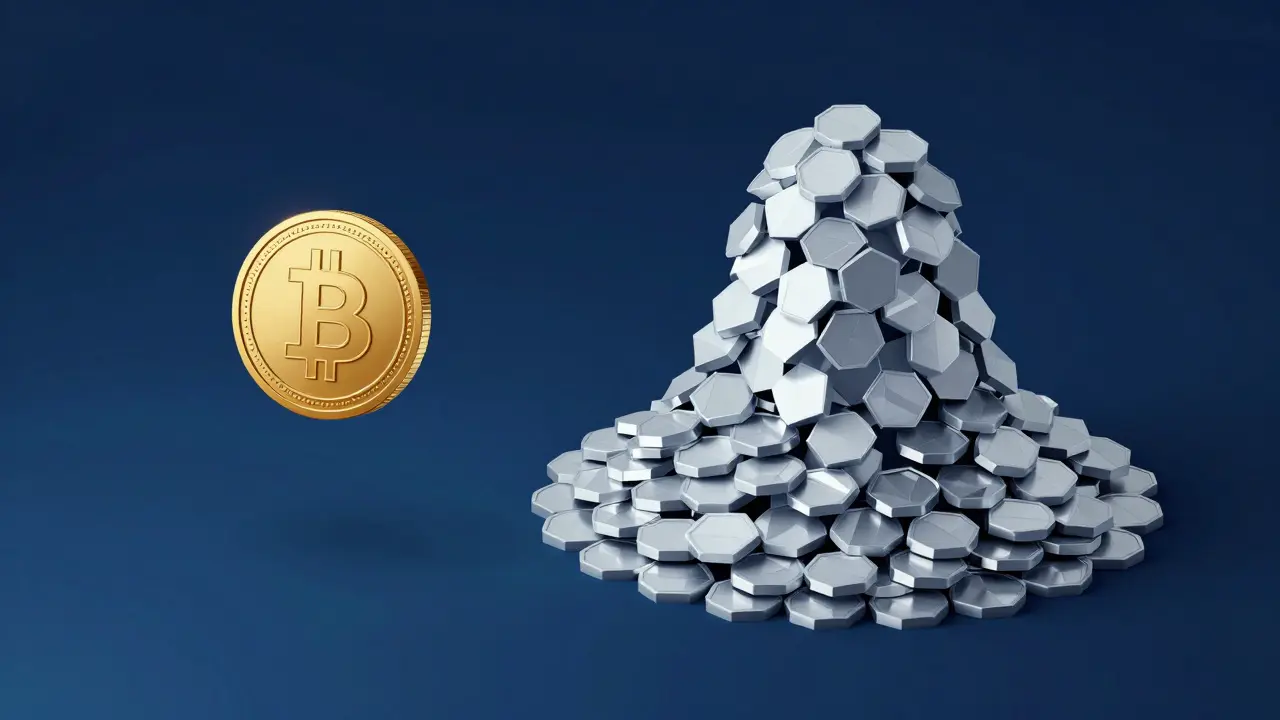
Let's break this down with real numbers. Take Bitcoin, the first and largest cryptocurrency by market cap. As of recent data, there are approximately 19.7 million Bitcoins in circulation. If the price of one Bitcoin is $6,654.91, you multiply those two numbers together. The result is roughly $131 billion (note: specific values fluctuate daily, but the logic remains constant). This number tells you the total dollar value of all Bitcoin currently held by investors, miners, and exchanges.
Compare this to a hypothetical new coin called 'MoonCoin.' Let's say MoonCoin has a price of $1.00, but there are 1 trillion coins in circulation. Its market cap would be $1 trillion. Even though MoonCoin's individual price is lower than Bitcoin's, its total market value is significantly higher because there are so many more of them. This comparison shows why focusing solely on the price per token is a trap for beginners.
Circulating Supply vs. Total Supply
To get an accurate market cap, you must understand what counts as 'supply.' Not all tokens created by a project are available for trading right now. This distinction is critical.
- Circulating Supply: These are the tokens that are actively being traded on public markets. They are held by users, exchanges, and miners. This is the number used in the standard market cap formula.
- Total Supply: This includes all tokens that have been created, including those that are locked up, held by the development team, or reserved for future rewards.
- Maximum Supply: This is the hard limit on how many tokens will ever exist. For example, Bitcoin has a maximum supply of 21 million coins. No more will ever be mined.
When you look at a market cap on a tracking site, it is almost always based on the circulating supply. However, some projects have complex tokenomics where large amounts of tokens are scheduled to unlock later. This leads us to another important metric: Fully Diluted Valuation (FDV).
Fully Diluted Valuation (FDV): The Future Market Cap
Fully Diluted Valuation, or FDV, answers the question: "What would the market cap be if every single token that will ever exist was already in circulation?"
You calculate FDV by multiplying the Maximum Supply by the Current Price.
Why does this matter? Imagine a new project launches with a price of $1. Only 1 million tokens are sold initially. The market cap is $1 million. Sounds small and manageable, right? But if the maximum supply is 1 billion tokens, and the remaining 999 million are locked for investors and the team, the FDV is $1 billion.
If those locked tokens eventually unlock and enter the market, the selling pressure could be massive. Investors who bought early might sell their shares, driving the price down. A high FDV relative to the current market cap often signals potential inflation risk. Smart investors watch the gap between market cap and FDV to avoid projects that are undervalued today but overvalued once all tokens are released.
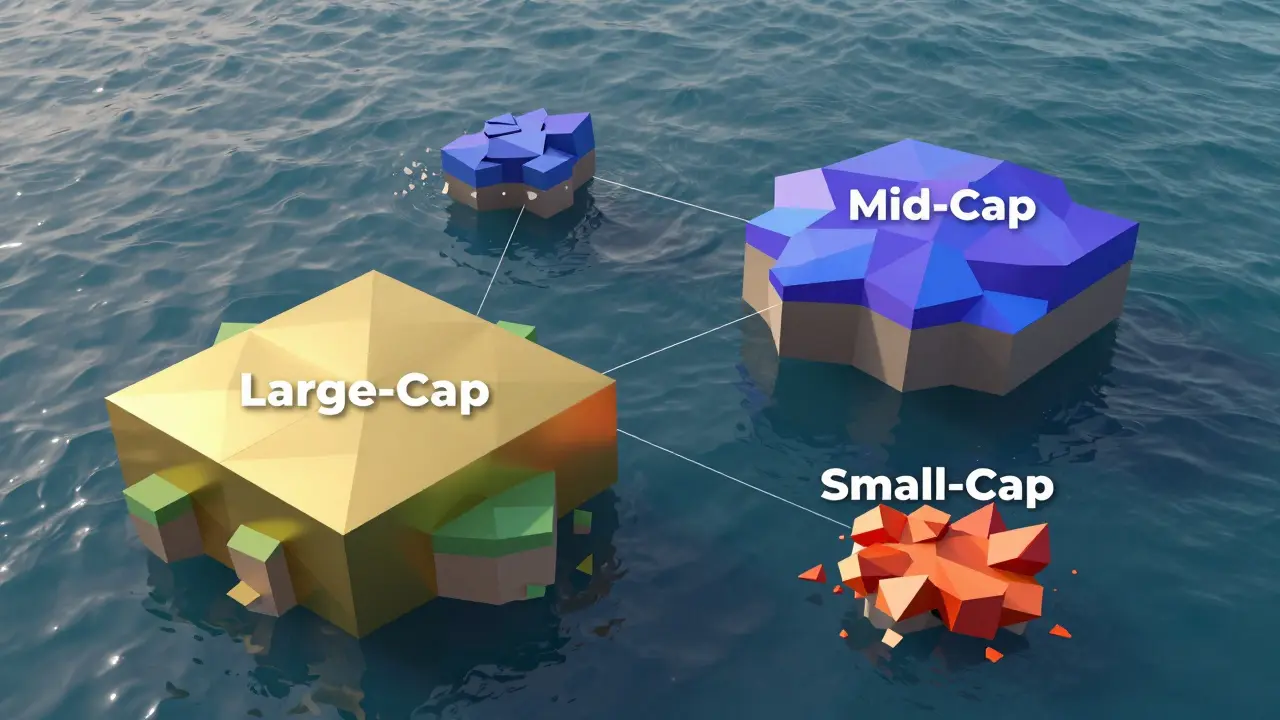
Understanding Crypto Market Cap Categories
Just like traditional stocks, cryptocurrencies are grouped into categories based on their market cap size. These categories help you gauge risk and stability. Here is how the industry generally breaks it down:
| Category | Market Cap Range | Risk Level | Characteristics |
|---|---|---|---|
| Large-Cap | $10 Billion+ | Lower | High liquidity, established track record, less volatile. Examples: Bitcoin, Ethereum. |
| Mid-Cap | $1 Billion - $10 Billion | Moderate | Growth potential, proven use cases, moderate volatility. Often includes major Layer-1 blockchains. |
| Small-Cap | $100 Million - $1 Billion | High | Higher risk, high reward potential, susceptible to market sentiment swings. |
| Micro-Cap | Under $100 Million | Very High | Extreme volatility, low liquidity, often speculative or experimental projects. |
Large-cap cryptocurrencies like Bitcoin and Ethereum are considered the 'blue chips' of the crypto world. They require billions of dollars in buying pressure to move their prices significantly, making them harder to manipulate. Micro-caps, on the other hand, can skyrocket or crash by 50% in a single day based on a single tweet or a small amount of trading volume. Knowing which category a coin falls into helps you decide whether you are looking for steady growth or high-risk speculation.
Why Market Cap Matters More Than Price
New investors often ask, "Which coin is cheaper, Bitcoin or Solana?" This is the wrong question. A better question is, "Which coin has more room to grow relative to its current market cap?"
Consider Solana, a high-performance blockchain platform known for fast transaction speeds. If Solana has a market cap of $80 billion and Bitcoin has a market cap of $1.3 trillion, Bitcoin is significantly larger. For Bitcoin to double in price, the entire market needs to inject hundreds of billions of dollars. For Solana to double, it requires less capital inflow. This doesn't mean Solana is a 'better' investment, but it highlights the difference in scale and the capital required to drive price changes.
Market cap also helps you compare assets across different ecosystems. You can compare the value of a DeFi token on Ethereum with a token on Binance Smart Chain using market cap, even if their decimal structures and total supplies are wildly different. It normalizes the data, giving you a level playing field for analysis.
How Market Cap Changes: Supply and Demand Dynamics
Market cap isn't static; it moves constantly. Two main factors drive these changes: price fluctuations and supply changes.
Price Movements: When traders buy more of a token, demand increases, pushing the price up. Since market cap is price multiplied by supply, the market cap rises proportionally. Conversely, selling pressure lowers the price and the market cap.
Supply Changes: Some cryptocurrencies have inflationary mechanisms. For example, Proof-of-Stake networks mint new tokens to reward validators. As these new tokens enter circulation, the circulating supply increases. If the price stays flat, the market cap still grows slightly due to the increased supply. On the flip side, some projects perform 'token burns,' permanently removing tokens from existence. This reduces the circulating supply, which can increase the scarcity and potentially drive up the price and market cap if demand remains constant.
Tracking Market Cap: Tools and Platforms
You don't need to do these calculations manually. Several platforms provide real-time data for thousands of cryptocurrencies.
- CoinMarketCap: One of the most popular aggregators, offering detailed charts, historical data, and community sentiment indicators.
- CoinGecko: Known for its independent indexing methods, providing robust data on niche categories like meme coins and liquid staking tokens.
These platforms allow you to sort coins by market cap, filter by category, and view the 'Global Crypto Market Cap,' which is the sum of all cryptocurrency values. This global metric serves as a health indicator for the entire industry. When the global market cap is rising, it generally signals bullish sentiment and institutional adoption. When it falls, it may indicate a bear market or regulatory headwinds.
Common Pitfalls and Misconceptions
Even experienced investors can trip up when interpreting market cap data. Here are three common mistakes to avoid:
- Ignoring Liquidity: A high market cap doesn't guarantee you can easily sell your tokens. If a coin has a $1 billion market cap but only $10,000 in daily trading volume, it is illiquid. You might not be able to sell large positions without crashing the price.
- Confusing Market Cap with Enterprise Value: In traditional finance, enterprise value includes debt and cash reserves. Crypto market cap is simpler-it's just the equity-like value of the tokens. It doesn't account for the underlying technology's revenue or utility directly.
- Overlooking Vesting Schedules: Always check the token distribution. If 50% of the supply is locked for the founders and will unlock next year, the current market cap is artificially low compared to the future reality. Always cross-reference market cap with FDV.
By understanding these nuances, you move beyond surface-level metrics and start analyzing cryptocurrencies like a professional. Market cap is your compass in the noisy crypto market. Use it to identify value, assess risk, and build a balanced portfolio.
Is market cap the same as price?
No, they are very different. Price is the cost of one single token. Market cap is the total value of all tokens in circulation. A coin can have a low price but a huge market cap if there are billions of tokens, or a high price but a small market cap if there are very few tokens.
What is a good market cap for a cryptocurrency?
There is no single 'good' market cap. It depends on your risk tolerance. Large caps ($10B+) are safer and more stable. Small caps (under $1B) offer higher growth potential but come with much higher risk of loss. Most diversified portfolios include a mix of both.
Can market cap go to zero?
Yes. If a cryptocurrency loses all interest, fails technologically, or is deemed a scam, its price can drop to near zero, making its market cap effectively zero. This is especially common in micro-cap and meme coin sectors.
What is the difference between circulating supply and total supply?
Circulating supply is the number of tokens currently available for trading on the market. Total supply includes all tokens that have been created, including those held by developers, teams, or locked in contracts. Market cap calculations typically use circulating supply.
Does a higher market cap mean a better investment?
Not necessarily. A higher market cap indicates stability and trust, but it also means less room for exponential growth. A smaller market cap project might have innovative technology and grow faster, but it carries significantly higher risk. Diversification is key.